GPUs seem to be all the rage these days. At the last Bayesian Valencia meeting, Chris Holmes gave a nice talk on how GPUs could be leveraged for statistical computing. Recently Christian Robert arXived a paper with parallel computing firmly in mind. In two weeks time I’m giving an internal seminar on using GPUs for statistical computing. To start the talk, I wanted a few graphs that show CPU and GPU evolution over the last decade or so. This turned out to be trickier than I expected.
After spending an afternoon searching the internet (mainly Wikipedia), I came up with a few nice plots.
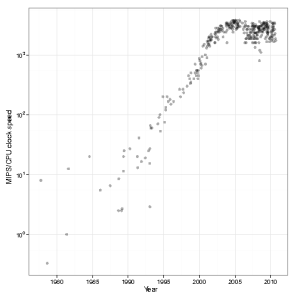
Intel CPU clock speed
CPU clock speed for a single cpu has been fairly static in the last couple of years – hovering around 3.4Ghz. Of course, we shouldn’t fall completely into the Megahertz myth, but one avenue of speed increase has been blocked:
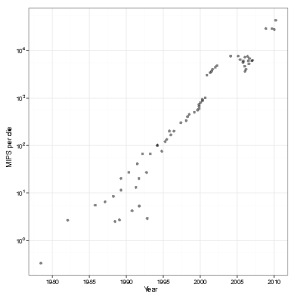
Computational power per die
Although single CPUs have been limited, due to the rise of multi-core machines, the computational power per die has still been increasing
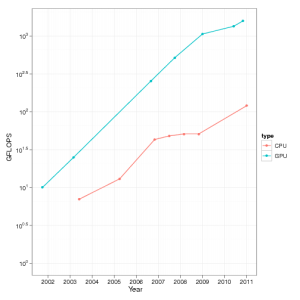
GPUs vs CPUs
When we compare GPUs with CPUs over the last decade in terms of Floating point operations (FLOPs), we see that GPUs appear to be far ahead of the CPUs
Sources and data
- You can download the data files and R code used to generate the above graphs.
- If you find them useful, please drop me a line.
- I’ll probably write further posts on GPU computing, but these won’t go through the R-bloggers site (since it has little to do with R).
- Data for Figures 1 & 2 was obtained from “Is Parallel Programming Hard, And, If So, What Can You Do About It?” This book got the data from Wikipedia
- Data from Figure 3 was mainly from Wikipedia and the odd mailing list post.
- I believe these graphs show the correct general trend, but the actual numbers have been obtained from mailing lists, Wikipedia, etc. Use with care.


There was a point where the 3.4Ghz limit seemed so definite, since the transformation of capacitive losses to heat-inducing resistance losses at that frequency became unsurmountable with commercial heat sinks. I always wanted to know whether that engineering snag stopped progress, at least temporarily. Of course, looking at your second graph, there doesn’t even appear to have been the slightest hiccup in processing power increases. Thank you, that was very informative.
Comment by Stefan — February 16, 2011 @ 7:28 pm
From a statistical/mathematical computing point of view, the first two graphs really highlight that we really have to start thinking about parallel computing to the extent that it is the norm, rather than the exception.
Comment by csgillespie — February 17, 2011 @ 1:27 pm
Please fix that last graph – it needs to on a log scale like the others.
Comment by Pierre — February 16, 2011 @ 11:57 pm
Good point (that I should have spotted). Graph is now on the log scale.
Comment by csgillespie — February 17, 2011 @ 1:25 pm
are you comparing single-precision-FLOPS of a gpu with double-precision of a CPU?
i think gpus started to support double precision 2 years ago or something …
Comment by Glen — February 17, 2011 @ 2:47 pm
That’s an excellent question. To be honest I didn’t really pay too much attention when I collected the numbers (they were pulled from mailing lists, wikipedia, etc), but I would imagine that it will be single precision. For two reasons:
1. If you switch to double precision FLOPS you make sure that it was completely clear (since it will be used in comparisons)
2. As you point out, in GPUs double precision has only just been available.
As an aside, Nvidia “turn-off” double precision in the cheaper Fermi cards!
Comment by csgillespie — February 17, 2011 @ 5:49 pm
The most important graph in terms of Moore’s law is missing – data bus width over time. If it was there, people would wonder why there’s such a massive gap between 32 and 64 bit compared to what happened before 32 bit. The missing 128 bit and 256 bit would stand out too.
Comment by Peeto — February 17, 2011 @ 11:49 pm
You’re right, that would make a very nice graph.
To be honest, I was surprised at how tricky it was to gather the above information. I just assumed that it would be available in multiple places on the web. So to get a graph of data bus width over time would be time consuming.
Comment by csgillespie — February 18, 2011 @ 5:23 pm
I do find your graphs very useful and I would like to use your numbers even if not very reliable. Thank you.
Comment by KK — July 8, 2011 @ 9:03 pm
You can download the data and code if you follow the link under the “Sources and data” section.
Comment by csgillespie — July 10, 2011 @ 2:36 pm
[…] if at least one article didn’t mention the word “GPUs”. Like any good geek, I was initially interested with the idea of using GPUs for statistical computing. However, last summer I messed about with […]
Pingback by Reviewing a paper that uses GPUs « Why? — July 17, 2011 @ 9:53 pm
Thanks for the useful data!
I used it in a presentation about multi core & ruby, re-rendered in Apple’s Keynote.
http://aldrin.martoq.cl/charlas/201107/20110727-multi-core-ruby/
Best regards,
Aldrin.
Comment by Aldrin Martoq — July 27, 2011 @ 6:41 am
Glad you found it useful. Hope your presentation went well.
Comment by csgillespie — July 27, 2011 @ 8:53 am