GPUs seem to be all the rage these days. At the last Bayesian Valencia meeting, Chris Holmes gave a nice talk on how GPUs could be leveraged for statistical computing. Recently Christian Robert arXived a paper with parallel computing firmly in mind. In two weeks time I’m giving an internal seminar on using GPUs for statistical computing. To start the talk, I wanted a few graphs that show CPU and GPU evolution over the last decade or so. This turned out to be trickier than I expected.
After spending an afternoon searching the internet (mainly Wikipedia), I came up with a few nice plots.
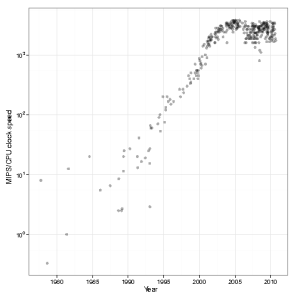
Intel CPU clock speed
CPU clock speed for a single cpu has been fairly static in the last couple of years – hovering around 3.4Ghz. Of course, we shouldn’t fall completely into the Megahertz myth, but one avenue of speed increase has been blocked:
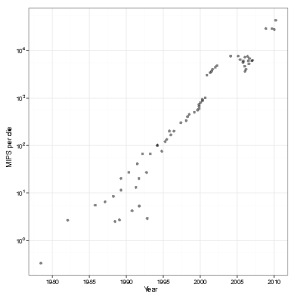
Computational power per die
Although single CPUs have been limited, due to the rise of multi-core machines, the computational power per die has still been increasing
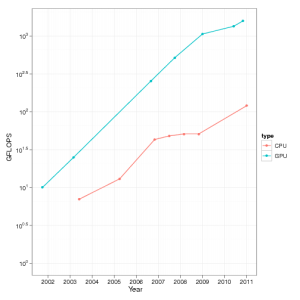
GPUs vs CPUs
When we compare GPUs with CPUs over the last decade in terms of Floating point operations (FLOPs), we see that GPUs appear to be far ahead of the CPUs
Sources and data
- You can download the data files and R code used to generate the above graphs.
- If you find them useful, please drop me a line.
- I’ll probably write further posts on GPU computing, but these won’t go through the R-bloggers site (since it has little to do with R).
- Data for Figures 1 & 2 was obtained from “Is Parallel Programming Hard, And, If So, What Can You Do About It?” This book got the data from Wikipedia
- Data from Figure 3 was mainly from Wikipedia and the odd mailing list post.
- I believe these graphs show the correct general trend, but the actual numbers have been obtained from mailing lists, Wikipedia, etc. Use with care.

