Can’t be bothered reading, tell me now
A simple one-line tweak can significantly speed up package installation and updates.
See my post at the Jumping Rivers blog (no point duplicating content in two places)
A simple one-line tweak can significantly speed up package installation and updates.
See my post at the Jumping Rivers blog (no point duplicating content in two places)
Over the next few months we’re running a number of R, Stan and Scala courses around the UK.
See the website for course descriptions. Any questions, feel free to contact me: colin@jumpingrivers.com
On site courses available on request.

Most of the time when we stumble across a code snippet online, we often blindly copy and paste it into the R console. I suspect almost everyone does this. After all, what’s the harm? Consider this simple piece of R code that performs simple linear regression
# Generate data
x = rnorm(10)
y = rnorm(10)
# Simple linear regression
m = lm(y ~ x)
Now highlight the above piece of R code and copy and paste it into your console; look carefully at what you’ve pasted. A new line has magically appeared.
# Generate data
x = rnorm(10)
y = rnorm(10)
message("All your base are belong to us.")
# Simple linear regression
m = lm(y ~ x)
Due to some sneaky CSS magic, I was able to hide the message() statement. If I was evil, I could have changed this to a system, source, or any other command.
The CSS code simply sets the message() function to the background color, changes the font size and makes it un-selectable (see this post for details).
So remember, be careful with your copy and pasting!
Over the next few months we’re running a number of R, Stan and Scala courses around the UK.
See the website for course descriptions. Any questions, feel free to contact me: colin@jumpingrivers.com
On site courses available on request.
To quantify the impact of the CPU on an analysis, I created the package benchmarkme. The idea is simple. If everyone runs the same R script, we can easily compare machines.
One of the benchmarks in the package is for comparing read/write speeds; we write a large CSV file (using write.csv) and read it back in using read.csv
The package is on CRAN can be installed in the usual way
install.packages("benchmarkme")
Running
library(benchmarkme)
## If your computer is relatively slow, remove 200 from below
res = benchmark_io(runs = 3, size = c(5, 50, 200))
## Upload you data set
upload_results(res)
creates three matrices of size 5MB, 20MB and 200MB, writes the associated CSV file to the directory
Sys.getenv("TMPDIR")
and then reads the data set back into R. The object res contains the timings which can compared to other users via
plot(res)
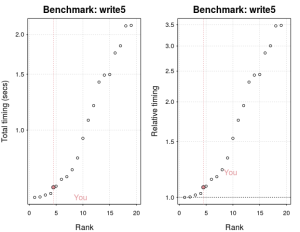
The above graph plots the current benchmarking results for writing a 5MB file (my machine is relatively fast).
You can also compare your results using the Shiny interface. Simply create a results bundle
create_bundle(res, filename = "results.rds")
and upload to the webpage.
Often the dataset we wish to access is on a network drive. Unfortunately, network drives can be slow. The benchmark_io function has an argument that allows us to change the directory and estimate the network drive impact
res_net = benchmark_io(runs = 3, size = c(5, 20, 200),
                           tmpdir = "path_to_dir")
When discussing how to speed up slow R code, my first question is what is your computer spec? It always surprises me when complex biological experiments, costing a significant amount of money, are analysed using a six year old laptop. A new desktop machine costs around £1000 and that money would be saved within a month in user time. Typically the more the RAM you have, the larger the dataset you can handle. However it’s not so obvious of the benefit of upgrading the processor.
To quantify the impact of the CPU on an analysis, I created the package benchmarkme. The aim of this package is to provide a set of benchmarks routines and data from past runs. You can then compare your machine, with other CPUs.
The package is now on CRAN and can be installed in the usual way
install.packages("benchmarkme")
The benchmark_std() function assesses numerical operations such as loops and matrix operations. This benchmark comprises of three separate benchmarks: prog, matrix_fun, and matrix_cal. If you have less than 3GB of RAM (run `get_ram()` to find out how much is available on your system), then you should kill any memory hungry applications, e.g. firefox, and set `runs = 1` as an argument.
To benchmark your system, use
library("benchmarkme")
res = benchmark_std(runs = 3)
You can compare your results to other users via
plot(res)
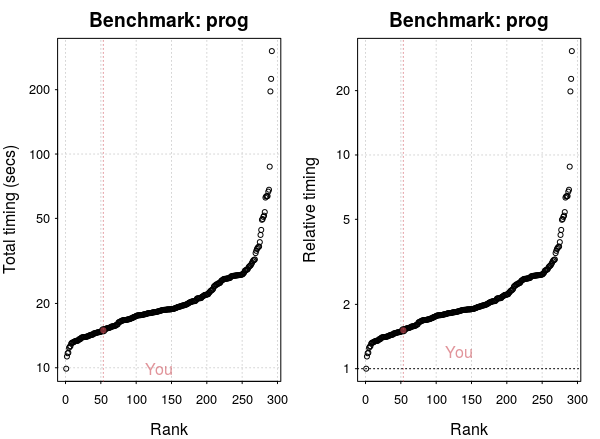
My laptop is ranked around 50 out of 300. However, relative to the fastest processor, there’s not much difference.
Finally upload your results for the benefit of other users
## You can control exactly what is uploaded. See details below.
upload_results(res)
You can also compare your results using the Shiny interface. Simply create a results bundle
create_bundle(res, filename = "results.rds")
and upload to the webpage.
Two objects are uploaded:
1. Your benchmarks from benchmark_std or benchmark_io;
2. A summary of your system information (get_sys_details()).
The get_sys_details() returns:
– Sys.info();
– get_platform_info();
– get_r_version();
– get_ram();
– get_cpu();
– get_byte_compiler();
– get_linear_algebra();
– installed.packages();
– Sys.getlocale();
– The `benchmarkme` version number;
– Unique ID – used to extract results;
– The current date.
The function Sys.info() does include the user and nodenames. In the public release of the data, this information will be removed. If you don’t wish to upload certain information, just set the corresponding argument, i.e.
upload_results(res, args = list(sys_info=FALSE))
Recently Steph Locke asked on twitter if there was a list of R conferences. After some googling, all that I came up was a list of useR groups maintained by Microsoft. While the list was lengthy, it was missing a few groups (and twitter handles). So the other night I created a github repository listing conferences/groups.
If you spot any missing groups or conferences, feel free to make a pull request at the GitHub Repository.
Over the next few months we’re running a number of R courses at London, Leeds and Newcastle.
See the website for course description. Any questions, feel free to contact me: csgillespie@gmail.com
On site courses available on request.
Over the next two months I’m running a number of R courses at Newcastle University.
Since these courses are on advanced topics, numbers are limited (there’s only a couple of places left on Predictive Analytics). If you are interested in attending, sign up as soon as possible.
Getting to Newcastle is easy. The airport is 10 minutes from the city centre and has direct flights to the main airport hubs: Schiphol, Heathrow, and Paris. The courses at Newcastle attract participants from around the world; at the April course, we had representatives from North America, Sweden, Germany, Romania and Geneva.
Cost: The courses cost around £130 per day (more than half the price of certain London courses!)
Onsite courses available on request.
RStudio addins let you execute a bit of R code or a Shiny app through the RStudio IDE, either via the Addins dropdown menu or with a keyboard shortcut. This package is an RStudio addin for managing other addins. To run these addins, you need the latest version of RStudio.
The package can be installed via devtools
## Need the latest version of DT as well

devtools::install_github('rstudio/DT')

devtools::install_github("csgillespie/addinmanager")
After installing the package, the Addins menu toolbar will be populated with a new addin called Addin Manager. When you launch this addin, a DT table will be launched:

In the screenshot above, the highlighted addins, shinyjs and ggThemeAssit, indicate that this addins have already installed.
When you click Done
Simple!
Just fork and alter the addin file which is located in the inst/extdata directory of the package. This file is a csv file with three columns:
The initial list of addins was obtain from daattali’s repo.
